Master Complexity with fdmon core
Beyond simple monitoring, fdmon* core provides a deep analytical layer to your infrastructure. Our solution is designed to handle massive data volumes without compromising speed, giving you the clarity needed to manage complex IT ecosystems.
* fast deployment monitoring
Master Complexity with fdmon core
Beyond simple monitoring, fdmon core provides a deep analytical layer to your infrastructure. Our engine is designed to handle massive data volumes without compromising speed, giving you the clarity needed to manage complex IT environments

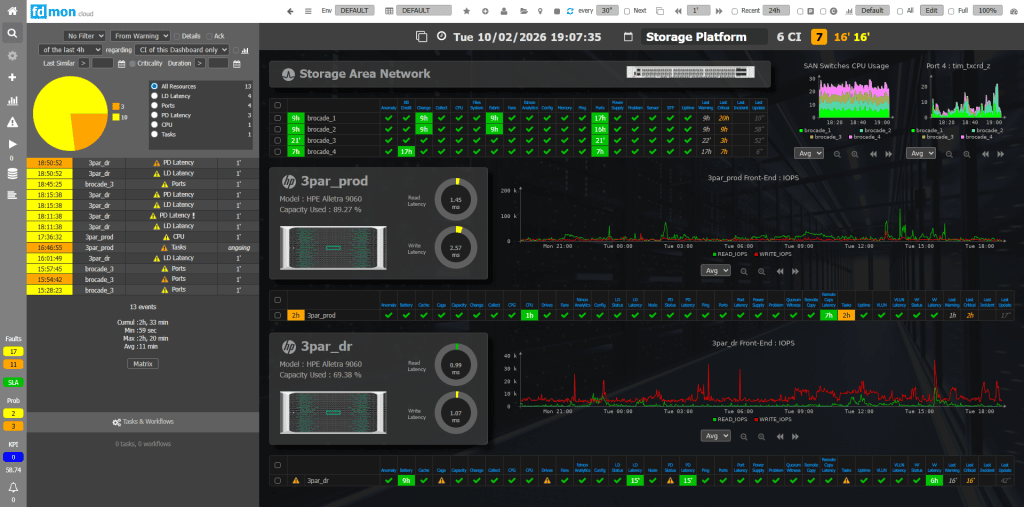
From Crisis to Solution in Seconds
When an incident occurs, every second counts. fdmon core sifts through millions of logs and metrics instantly to identify the root cause, and helps you to interact with suspected components.
Trigger auto-remediation pipelines or business-as-usual and preventive automated operations from fdmon core.
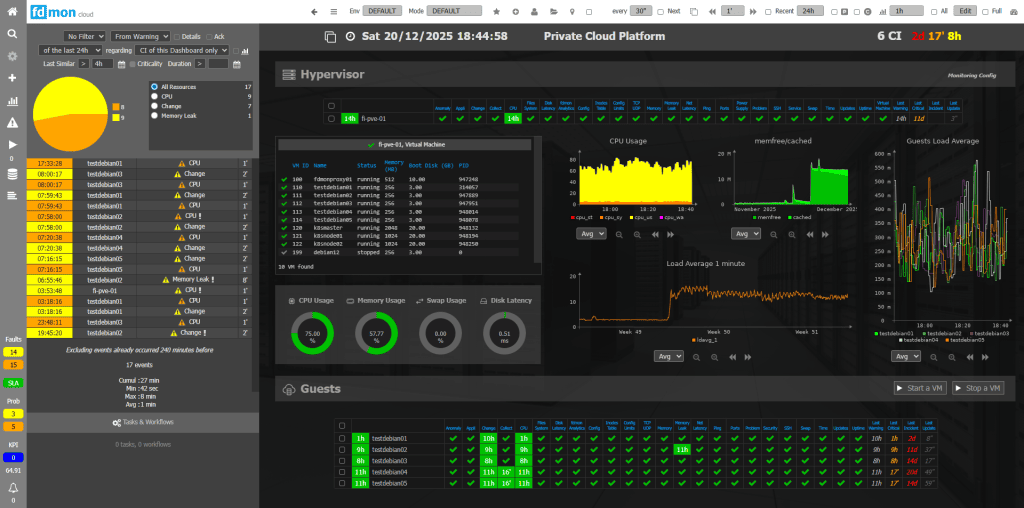
N-Years Data Access
Access full historical data without performance degradation
Drill-Down Capability
Go from a global overview to the specific metric in two clicks
Predictive Correlation
Identify patterns that lead to failures before they impact your users
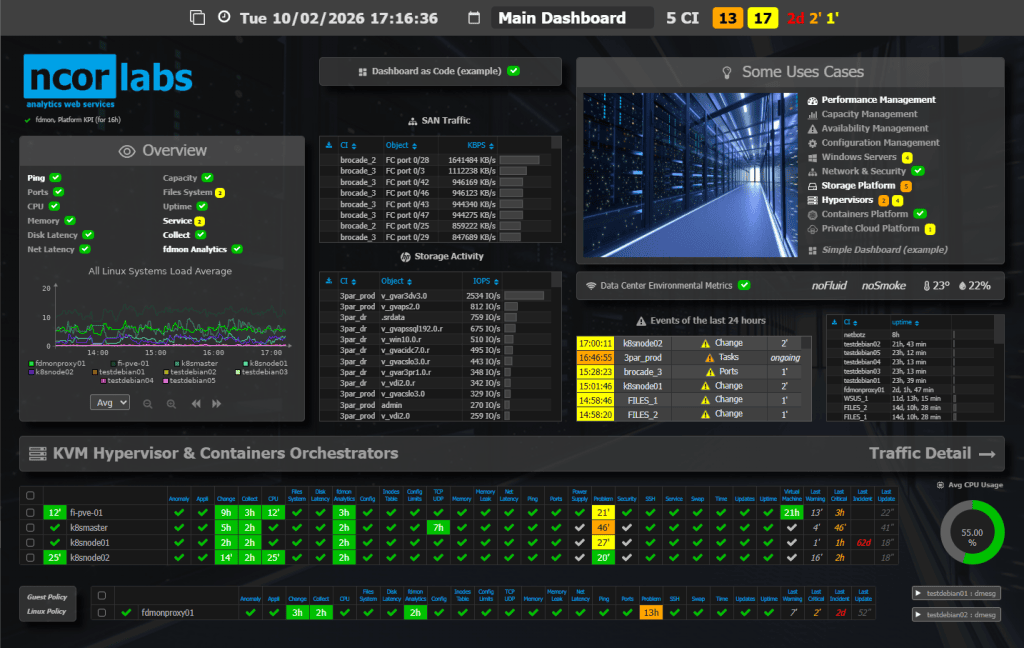


Zero Intrusion, Total Visibility
fdmon core operates on an Agentless model. This means no software to install on your critical components, reducing security risks and deployment time.
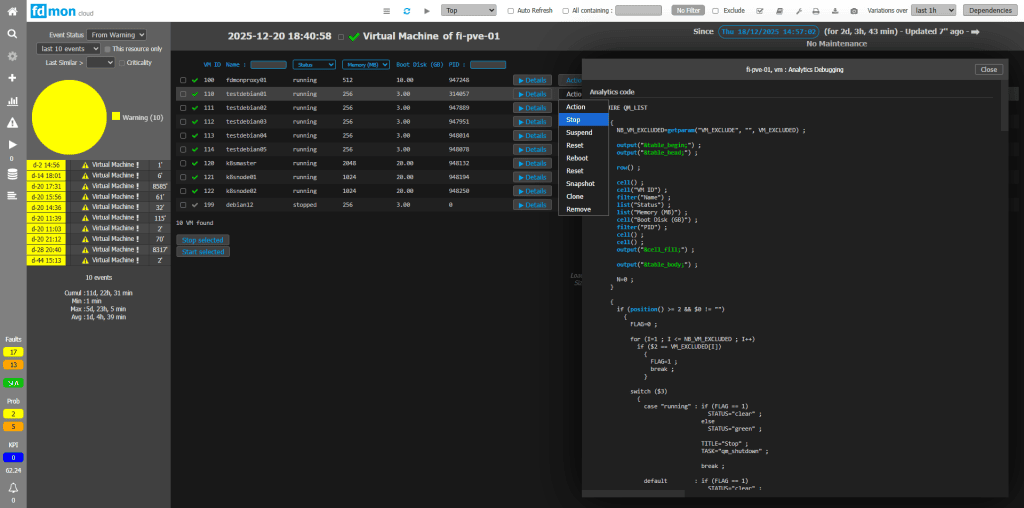
Zero Architectural Effort, All AIOps Bricks Included
Analytics, Real Time Monitoring, Meta Monitoring, IOT Support, External Events, Trending, Diagnostic, Threat Detection, Anomaly Detection, Change Detection, Event Prediction, Metric Forecasting, Logs Management, Auditability, Tracing, Inventory, Automation, Orchestration, Auto-Remediation, Dashboards, API Studio, Journaling Studio, Online-Documentation Studio, Scheduling, Federative Portal, Role-Based Access Control, Simulation, …
- Native Compatibility Seamless integration with SNMP, WMI, SSH, SQLNET, TDS, SMI-S, Syslog, etc ... and IoT protocols
- Infinite Evolutivity Implementation framework for new observability protocols and technologies. Everything-as-Code
- Infinite Customization Building complete multi-tenant monitoring and automation portals
- Openness Interoperability with other Monitoring, Orchestration, ITSM & CI/CD Solutions. Federation
- Hybrid Ready One single pane of glass for On-Premises, Cloud, and Edge assets
- User-Centric Unmatched quickness of the GUI. Real-time monitored UX. Fast deployment of new assets
Our solutions
Legals informations